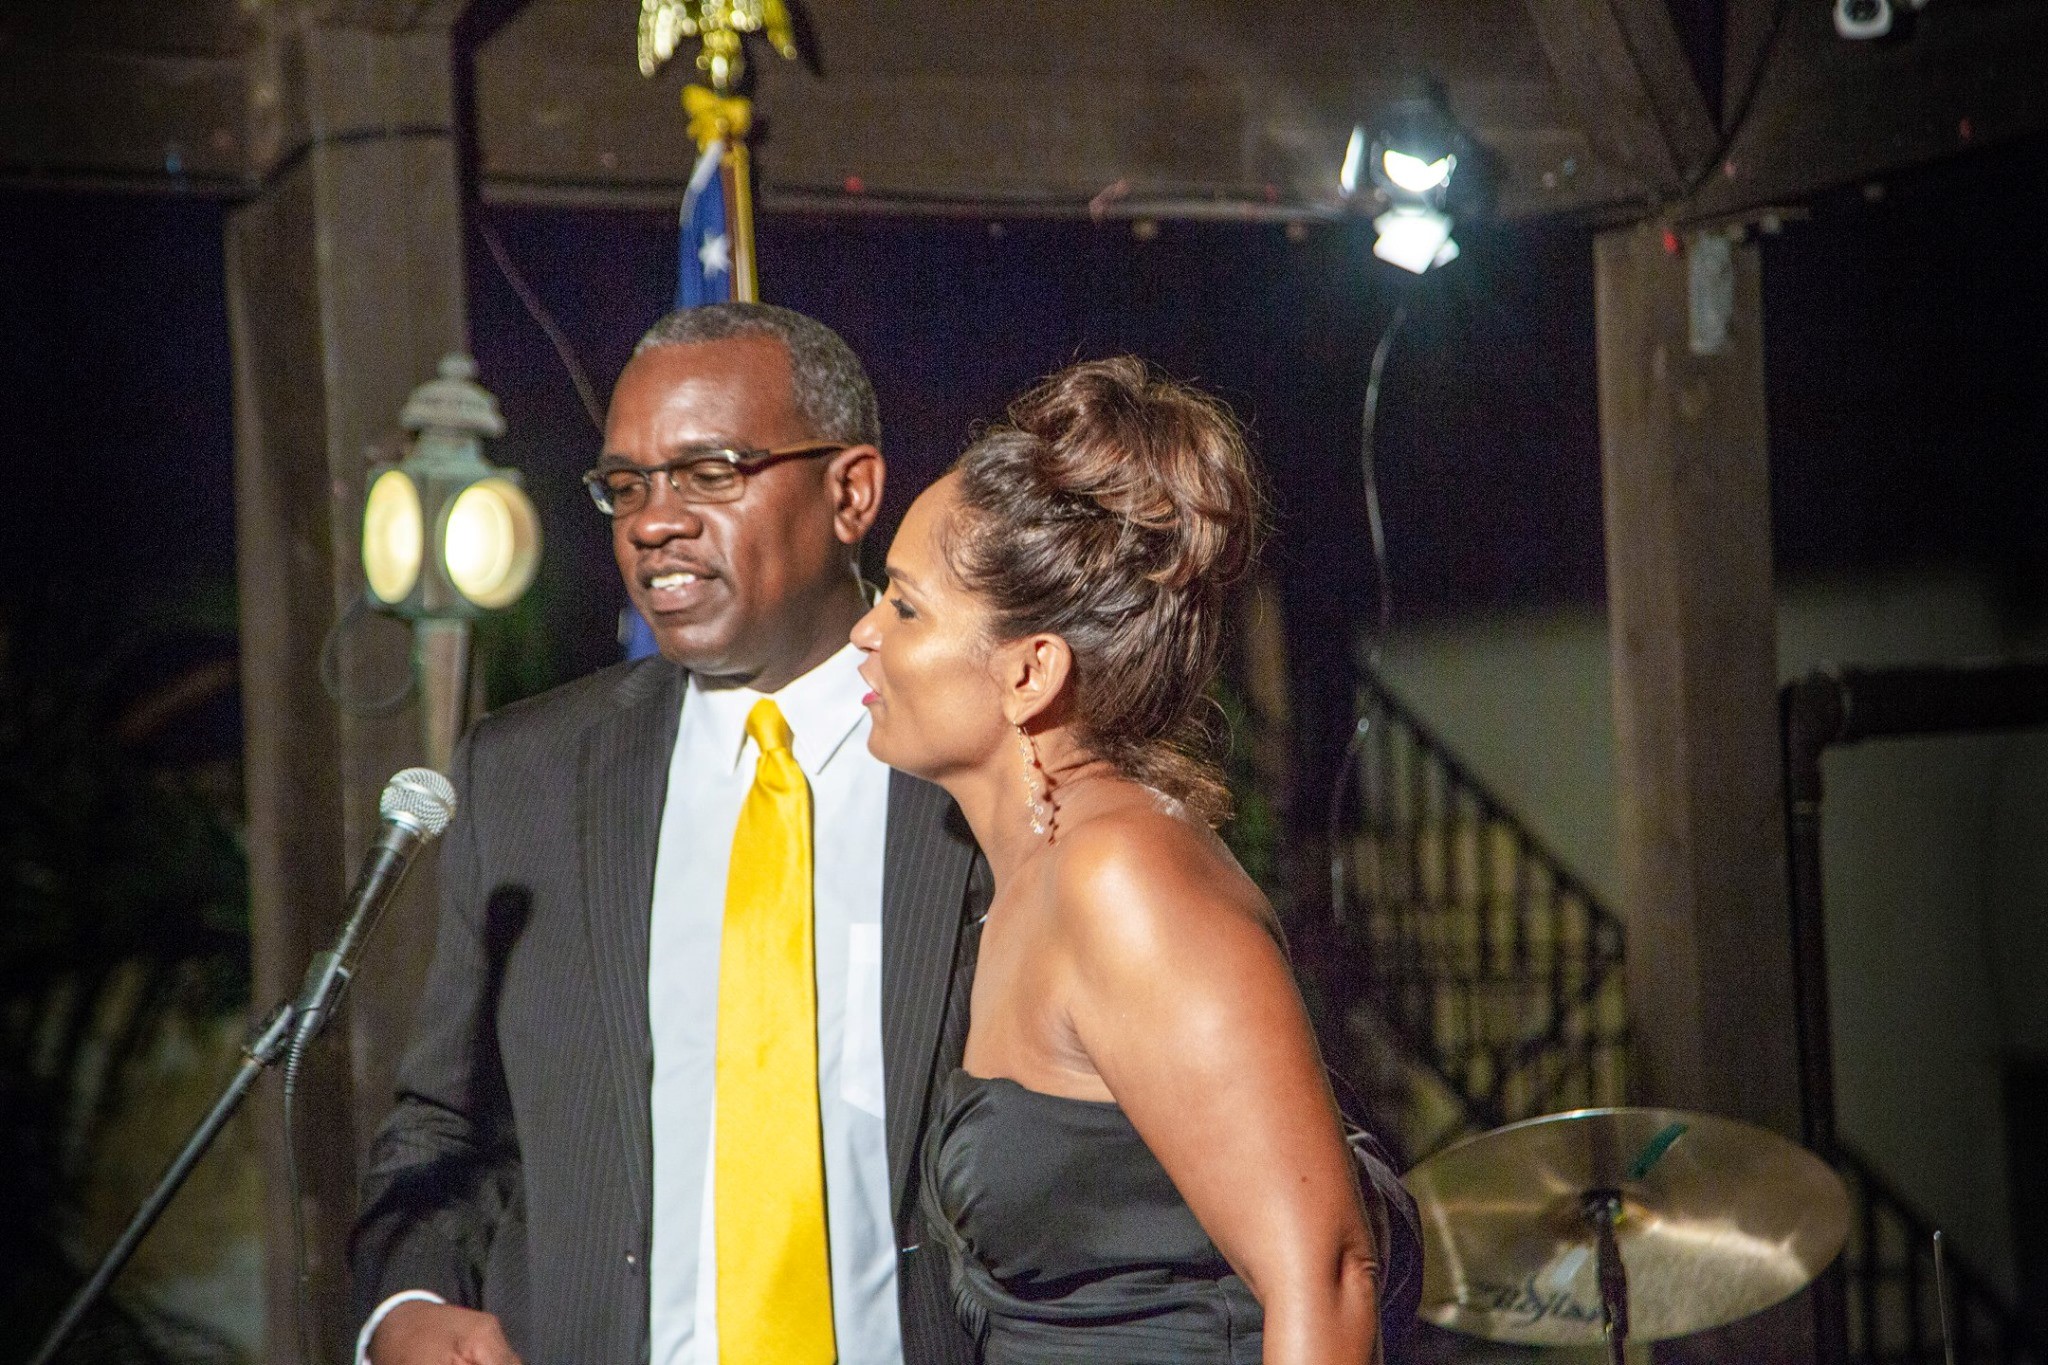
FUTURE GOVERNOR AND FIRST LADY? UVI’s VI TECH Stack Says Albert Bryan Jr. (pictured here with Yolanda Bryan his wife) will get the most votes in tomorrow’s elections.
CHARLOTTE AMALIE — The University of the Virgin Islands says it interviewed 800 people, of those interviewed, 86 percent said that they are likely to vote in the 2018 general elections.
The polling, completed by UVI’s “VI TECH Stack” from October 27 to 30 came up with these results asking if the election were held today, who would you vote for?
The results are below:
GOVERNOR’S RACE (ST. CROIX)
Albert Bryan Jr. 31%
Kenneth Mapp 25%
Undecided 18%
Adlah Donastorg 11%
Warren Mosler 7%
Soraya Diase Coffelt 5%
Janette Millin Young 2%
Moleto Smith 1%
SENATORS ST. THOMAS
Donna Frett Gregory 13%
Janelle K. Sarauw 12%
Athneil “Bobby” Thomas 11%
Marvin A. Blyden 7%
Myron D. Jackson 6%
Dwayne M. DeGraff 6%
Stedmann Hodge, Jr. 6%
Jean A. Forde 5%
Carla Joseph 5%
Alma Francis Heyliger 4%
Stephen “Smokey” Frett 3%
Irvin Pudna Mason, Sr. 2%
Dolores Todmann 2%
Bruce Flamon 2%
Wilma Marsh Monsanto 1%
George Trager 1%
Gustave R. Dowling 1%
GOVERNOR’S RACE (ST. THOMAS-ST. JOHN)
The poll also asked an additional 400 people if the governor’s race was held today, how would you vote?
The answer of that question asked between October 27 to 30 is:
Albert Bryan 39%
Undecided 19%
Kenneth Mapp 14%
Adlah Donastorg 13%
Soraya Diase Coffelt 5%
Warren Mosler 5%
Moleto A. Smith 3%
Janette Millin Young 2%
Conducted: October 27 – 30, 2018
Number of Respondents: 800
MoE: ±3.46%
Q. Are you registered to vote?
Yes 100%
Q. Thinking ahead, how likely are you to vote in the general election?
Certain 86%
Likely 10%
50/50 chance 4%
Total 100%
Q. If the election for Senator at-large were held today, would you support Sherry-Ann Francis,
Angel L. Bolques Jr., or Steven D. Payne Sr?
Steven D. Payne Sr 25%
Sherry-Ann Francis 21%
Angel L. Bolques Jr 17%
Undecided 37%
Total 100%
Q. Governor Mapp has proposed a plan that would allow students who graduate from
qualifying high schools to attend the University of the Virgin Islands for free. Do you approve or
disapprove of this plan?
Approve 67%
Disapprove 15%
No opinion 18%
Total 100%
Q. Do you approve or disapprove of how Governor Mapp is handing the recovery efforts of the
Territory in the aftermath of the hurricanes?
Strongly approve 26%
Somewhat approve 23%
Somewhat disapprove 19%
Strongly disapprove 19%
No opinion 13%
Total 100%
Q. Do you approve or disapprove of how Governor Mapp is handling the economy?
Approve 29%
Disapprove 49%
No opinion 23%
Total 100%
Q. Do you approve or disapprove of the way the 32nd Legislature is handling its job?
Approve 11%
Disapprove 67%
No opinion 23%
Total 100%
Q. Which of the following issues will be most important in deciding your vote for the Legislature
this November?
The economy 37%
Healthcare 18%
Education 15%
Infrastructure 13%
Retirement security 11%
Crime 6%
Total 100%
Lastly, I am going to read you a list of names of people active in politics in your area. After I read
each one, please tell me if you have a favorable or unfavorable opinion of that person.
Q. Kenneth E. Mapp
Very Favorable 20%
Somewhat Favorable 17%
Somewhat Unfavorable 13%
Very Unfavorable 36%
No Opinion 15%
Total 100%
Q. Soraya Diase Coffelt
Very Favorable 10%
Somewhat Favorable 24%
Somewhat Unfavorable 8%
Very Unfavorable 21%
No Opinion 37%
Total 100%
Q. Warren Mosler
Very Favorable 11%
Somewhat Favorable 21%
Somewhat Unfavorable 7%
Very Unfavorable 25%
No Opinion 37%
Total 100%
Q. Adlah “Foncie” Donastorg
Very Favorable 10%
Somewhat Favorable 15%
Somewhat Unfavorable 14%
Very Unfavorable 28%
No Opinion 33%
Total 100%
Q. Janette Millin Young
Very Favorable 4%
Somewhat Favorable 19%
Somewhat Unfavorable 12%
Very Unfavorable 24%
No Opinion 41%
Total 100%
Q. Albert Bryan
Very Favorable 29%
Somewhat Favorable 23%
Somewhat Unfavorable 6%
Very Unfavorable 17%
No Opinion 26%
Total 100%
Q. Moleto A. Smith
Very Favorable 5%
Somewhat Favorable 17%
Somewhat Unfavorable 8%
Very Unfavorable 18%
No Opinion 53%
Total 100%
Demographics
Party
Republican Party 8%
Democratic Party 54%
Independent Citizens Movement 7%
No party or independent 24%
Not sure 7%
Total 100%
Gender
Male 48%
Female 52%
Total 100%
Age
18-34 16%
35-49 23%
50-64 32%
65 and over 29%
Can’t say 1%
Total 100%
Interview Mode
IVR 10%
Live 10%
Online 80%
Total 100%
Region
St. Croix 51%
St. Thomas and St. John 49%
Total 100%
St. Thomas and St. John, United States Virgin Islands General Election
Poll Results
Conducted: October 27 – 30, 2018
Number of Respondents: 400
MoE: ±4.9%
Q. Are you registered to vote?
Yes 100%
Q. Thinking ahead, how likely are you to vote in the general election?
Certain 84%
Likely 11%
50/50 chance 5%
Total 100%
Q. If the election for Governor of the United States Virgin Islands were held today, would you
support Kenneth E. Mapp, Adlah “Foncie” Donastorg, Soraya Diase Coffelt, Janette Millin
Young, Albert Bryan, Moleto A. Smith, or Warren Mosler?
Albert Bryan 39%
Kenneth E. Mapp 14%
Adlah “Foncie” Donastorg 13%
Soraya Diase Coffelt 5%
Warren Mosler 5%
Moleto A. Smith 3%
Janette Millin Young 2%
Undecided 19%
Total 100%
Q. If the election for Senator at-large were held today, would you support Sherry-Ann Francis,
Angel L. Bolques Jr., or Steven D. Payne Sr?
Steven D. Payne Sr 26%
Sherry-Ann Francis 21%
Angel L. Bolques Jr 19%
Undecided 35%
Total 100%
Q. If the election for St. Thomas/St. John District senate were held today, who would your top
choices be?
Donna Frett Gregory 13%
Janelle K. Sarauw 12%
Athneil “Bobby” Thomas 11%
Marvin A. Blyden 7%
Myron D. Jackson 6%
Dwayne M. DeGraff 6%
Stedmann Hodge, Jr. 6%
Jean A. Forde 5%
Carla Joseph 5%
Alma Francis Heyliger 4%
Stephen “Smokey” Frett 3%
Irvin Pudna Mason, Sr. 2%
Dolores Todmann 2%
Bruce Flamon 2%
Wilma Marsh Monsanto 1%
George Trager 1%
Gustave R. Dowling 1%
Margaret Price 1%
Undecided 13%
Total 100%
Q. Governor Mapp has proposed a plan that would allow students who graduate from
qualifying high schools to attend the University of the Virgin Islands for free. Do you approve or
disapprove of this plan?
Approve 64%
Disapprove 15%
No opinion 21%
Total 100%
Q. Do you approve or disapprove of how Governor Mapp is handing the recovery efforts of the
Territory in the aftermath of the hurricanes?
Strongly approve 14%
Somewhat approve 23%
Somewhat disapprove 19%
Strongly disapprove 31%
No opinion 14%
Total 100%
Q. Do you approve or disapprove of how Governor Mapp is handling the economy?
Approve 19%
Disapprove 56%
No opinion 25%
Total 100%
Q. Do you approve or disapprove of the way the 32nd Legislature is handling its job?
Approve 11%
Disapprove 66%
No opinion 23%
Total 100%
Q. Which of the following issues will be most important in deciding your vote for the Legislature
this November?
The economy 38%
Infrastructure 15%
Education 15%
Retirement security 14%
Healthcare 11%
Crime 7%
Total 100%
Lastly, I am going to read you a list of names of people active in politics in your area. After I read
each one, please tell me if you have a favorable or unfavorable opinion of that person.
Q. Kenneth E. Mapp
Very Favorable 10%
Somewhat Favorable 15%
Somewhat Unfavorable 23%
Very Unfavorable 35%
No Opinion 18%
Total 100%
Q. Adlah “Foncie” Donastorg
Very Favorable 12%
Somewhat Favorable 17%
Somewhat Unfavorable 21%
Very Unfavorable 19%
No Opinion 31%
Total 100%
Q. Soraya Diase Coffelt
Very Favorable 12%
Somewhat Favorable 28%
Somewhat Unfavorable 9%
Very Unfavorable 13%
No Opinion 38%
Total 100%
Q. Janette Millin Young
Very Favorable 7%
Somewhat Favorable 26%
Somewhat Unfavorable 17%
Very Unfavorable 13%
No Opinion 37%
Total 100%
Q. Albert Bryan
Very Favorable 37%
Somewhat Favorable 24%
Somewhat Unfavorable 8%
Very Unfavorable 7%
No Opinion 24%
Total 100%
Q. Moleto A. Smith
Very Favorable 7%
Somewhat Favorable 22%
Somewhat Unfavorable 11%
Very Unfavorable 10%
No Opinion 50%
Total 100%
Q. Warren Mosler
Very Favorable 10%
Somewhat Favorable 21%
Somewhat Unfavorable 11%
Very Unfavorable 15%
No Opinion 43%
Total 100%
Demographics
Party
Republican Party 7%
Democratic Party 56%
Independent Citizens Movement 6%
No party or independent 24%
Not sure 8%
Total 100%
Gender
Male 48%
Female 52%
Total 100%
Age
18-34 16%
35-49 23%
50-64 32%
65 and over 29%
Can’t say 1%
Total 100%
Interview Mode
Phone 5%
Online 95%
Total 100%
ALL POLLING BY: VI TECH Stack

