 John McCarthy
By: Virgin Islands Free Press News Desk
The Big Picture: A Return to Realities
After a dramatic second-quarter surge that saw private-sector establishments generate over 3,500 gross job gains, the U.S. Virgin Islands economy experienced a predictable recalibration in the third quarter of 2025.
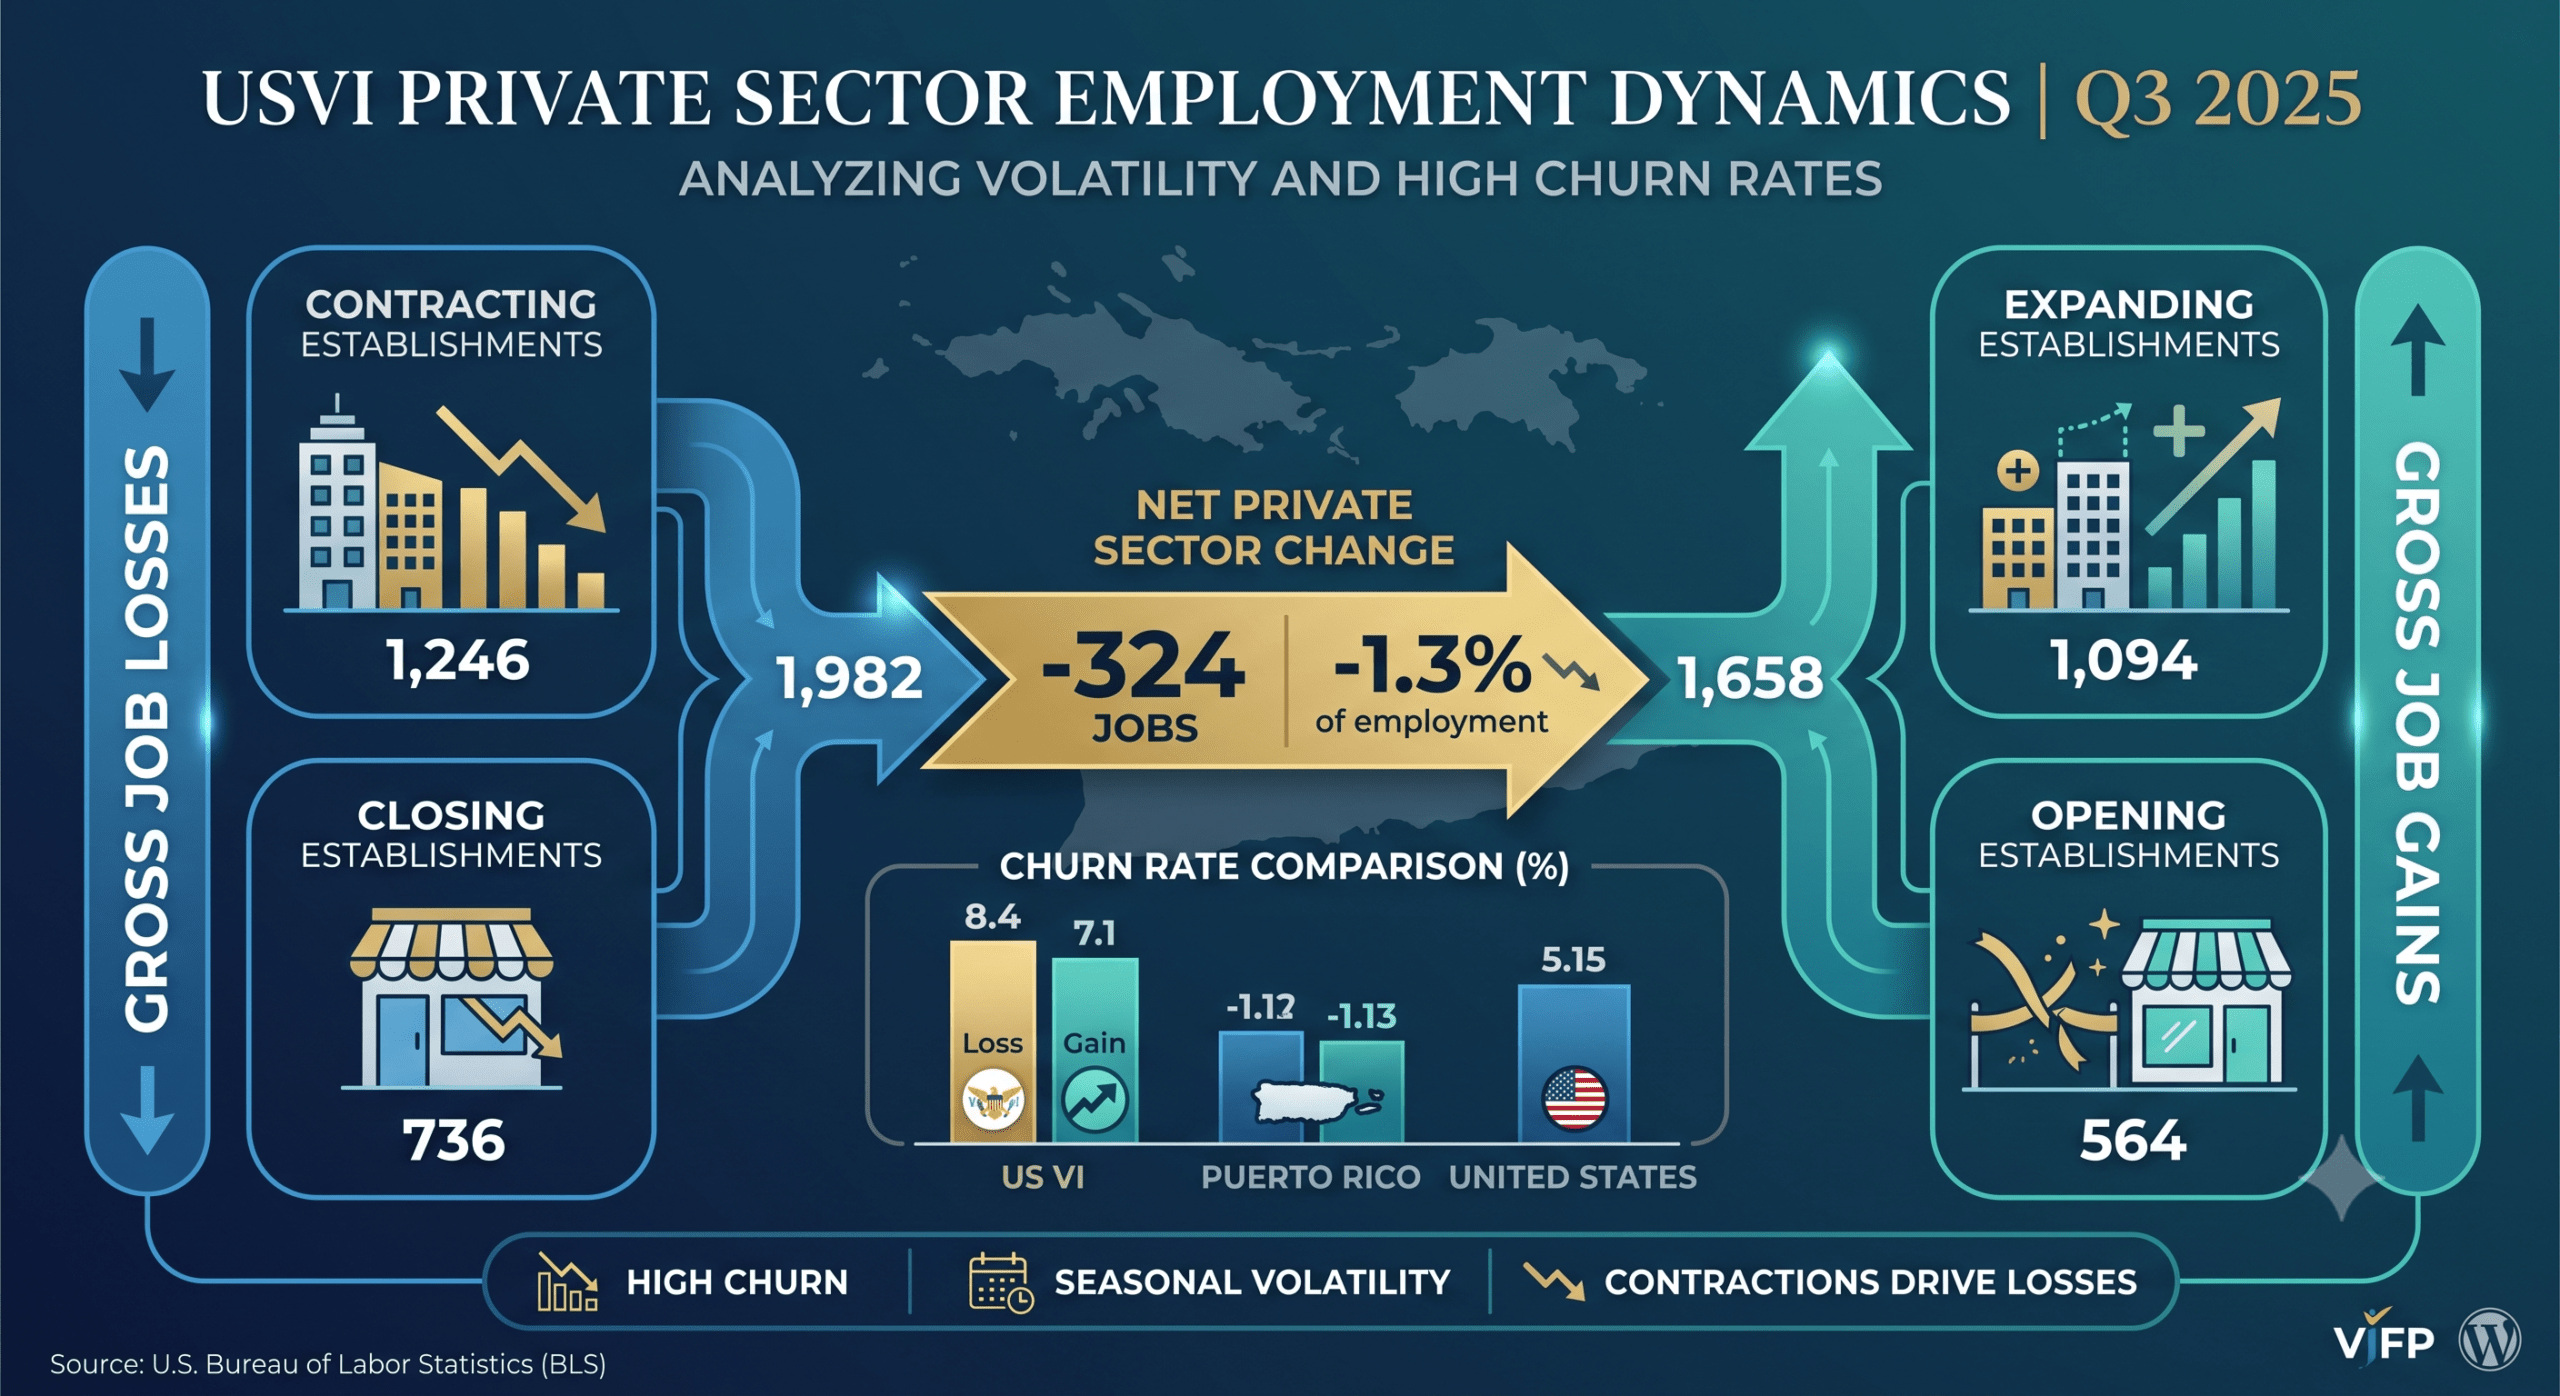
According to data released by the U.S. Bureau of Labor Statistics (BLS), gross private-sector job losses totaled 1,982 between June and September 2025, outpacing gross job gains of 1,658. The net result was a loss of 324 private-sector positions (-1.3 percent of employment), reversing the territory’s brief positive momentum from earlier in the year.
While a quarterly deficit of 324 jobs may appear modest in absolute terms, it represents a substantial swing in an island economy with a compact workforce. More importantly, it underscores the persistent structural volatility that defines doing business in the territory.
Key Metrics Breakdown
========================================================================
USVI PRIVATE SECTOR EMPLOYMENT DYNAMICS (Q3 2025)
========================================================================

  GROSS JOB GAINS: 1,658 (7.1% of employment)
  ├── Expanding Establishments : 1,094 jobs
  └── Opening Establishments   :   564 jobs

  GROSS JOB LOSSES: 1,982 (8.4% of employment)
  ├── Contracting Establishments: 1,246 jobs
  └── Closing Establishments    :   736 jobs

  NET PRIVATE SECTOR CHANGE    :  -324 jobs (-1.3%)
========================================================================
Contractions vs. Closures
A critical detail within the Q3 numbers is where the job losses occurred:
- Contracting Establishments: Existing firms trimming staff accounted for 1,246 lost jobs, up from 1,029 in the preceding quarter. This indicates that established local merchants, hospitality vendors, and service providers were actively scaling back operations or tightening payrolls heading into late summer.
- Closing Establishments: Complete business closures accounted for 736 lost jobs. While still significant, this represents a notable drop from the 1,201 jobs lost to closures in Q2, suggesting that outright business failures slowed even as individual firms downsized.
High Churn: USVI vs. National & Regional Baselines
The defining feature of the Virgin Islands commercial ecosystem is its extraordinary churn rate—the simultaneous creation and destruction of jobs relative to overall employment size.
========================================================================
GROSS JOB CHURN RATES (Q3 2025)
========================================================================

  U.S. VIRGIN ISLANDS
  Gain Rate : [███████████████] 7.1%
  Loss Rate : [███████████████████] 8.4%
  Total Churn: 15.5%

  PUERTO RICO
  Gain Rate : [██████████] 4.8%
  Loss Rate : [█████████] 4.3%
  Total Churn: 9.1%

  UNITED STATES (NATIONAL AVERAGE)
  Gain Rate : [████████████] 5.6%
  Loss Rate : [████████████] 5.7%
  Total Churn: 11.3%

========================================================================
Why the High Churn Matters
- Amplified Risk Exposure: At 8.4%, the territory’s gross loss rate significantly exceeded both the national average (5.7%) and neighboring Puerto Rico (4.3%). In an island territory, high fixed operational costs—from utility tariffs to freight shipping—leave businesses with far slimmer margins, forcing quicker workforce contractions during slower economic windows.
- Dynamic Openings: Conversely, when conditions align, the local economy expands aggressively. The territory’s 7.1% gain rate outpaced the national baseline (5.6%), driven by quick commercial pivots in tourism, construction, and localized services.
The Historical Perspective: A Five-Quarter Lookback
To understand Q3 2025, one must look at the four quarters preceding it. The territory has navigated prolonged periods of contraction punctuated by sudden expansion.
| Quarter | Gross Gains | Gross Losses | Net Change | Trajectory |
| Q3 2024 | 1,162 | 1,862 | -700 | Heavy Contraction |
| Q4 2024 | 1,238 | 2,534 | -1,296 | Peak Losses |
| Q1 2025 | 1,239 | 1,735 | -496 | Moderate Deficit |
| Q2 2025 | 3,514 | 2,230 | +1,284 | Major Expansion |
| Q3 2025 | 1,658 | 1,982 | -324 | Stabilization / Retrenchment |
The massive gain in Q2 2025 (+1,284) stands out as an outlier driven by concentrated opening activity (1,759 jobs at opening establishments alone). Q3 represents a return toward the baseline, where underlying structural pressures—workforce availability, supply chain lag, and seasonal tourism cycles—reassert themselves.
Editorial Commentary & Economic Outlook
For local policymakers, business leaders, and newsroom analysts, these figures carry clear strategic implications:
- The Seasonal Reality: The territory’s private sector remains highly sensitive to seasonal transitions. As tourism shifts and major infrastructure projects pause or complete phases, payrolls fluctuate rapidly.
- Retention Over Attraction: While policy often focuses on attracting new business openings, the data shows that payroll contractions at existing firms (1,246 jobs lost) were the primary driver of the Q3 deficit. Economic development strategies must focus as much on helping existing employers maintain stable payrolls as on recruitments.
- Infrastructure Bottlenecks: High churn rates reflect an environment where operating costs make sustained employment difficult for small-to-medium enterprises. Addressing core infrastructure stability remain essential prerequisites for smoothing out these quarterly swings.
The next BLS report, scheduled for release in late July 2026, will cover Q4 2025—offering a clear look at how the private sector fared during the crucial winter tourist season kickoff.